
What is a demagnetization curve?
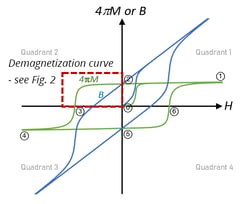
Ferromagnetic materials such as iron, cobalt, nickel, and many alloys, including permanent magnets, show a magnetic hysteresis phenomenon. The hysteresis loop is generated by measuring the magnetization M, while changing the applied external magnetic field H (see green curve in the figure to the left).
The magnetization in a ferromagnetic material increases from 0 or ‘virgin’ state (point ⓪ as show in the figure to the left) due to an increasing applied magnetic field, to a maximum--the point where the magnetization does not increase anymore, called magnetic saturation (point ①). Upon reducing the magnetic field back to 0, permanent magnets still retain a high value of magnetization (point ②) also known as Br. The magnetization will eventually decrease to 0 (point ③) by applying a magnetic field in the opposite direction. The magnetic saturation in the opposite direction will occur (point ④) with increasing magnetic field in that direction.
Why is the demagnetization curve important?
Important magnetic properties of permanent magnets, such as residual induction Br, coercivity Hc, intrinsic coercivity Hci, and maximum energy product (BH)max, can be obtained from demagnetization curves.
Br is the residual induction or flux density, which represents the magnetic induction corresponding to zero magnetizing field in a magnetic material after full saturation when measured in a closed magnetic circuit. The unit for magnetic induction B and residual induction Br is G, Gauss (CGS unit) or T, Tesla (SI unit).
Mr is the remanent magnetization or remanence, which represents the retained magnetization when the external magnetic field is reduced to zero after full saturation when measured in a closed magnetic circuit.
The unit for magnetization 4πM and remanent magnetization 4πMr is G, Gauss (CGS unit) or A/m, Ampere per meter (SI unit)...

